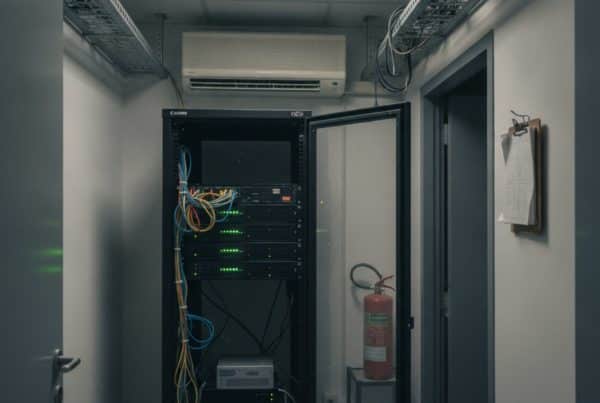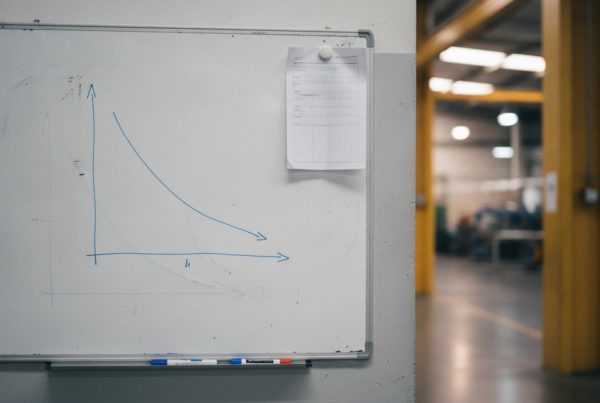
Consumption sits in the meter. Production, in the management system. Invoices, with administration. Machine states, with maintenance. Each holds part of the information, but bringing it together to make a decision is still a manual job.
This is how you end up with energy silos: data that exists but remains separate, making it hard to understand how much each process costs, why consumption changes or where action is worth taking.
The Smart Energy Congress 2026, organised by enerTIC, will take place on 14 and 15 October at IFEMA Madrid. Its agenda covers digitalisation, IT/OT integration and the use of data to improve energy competitiveness. For industrial companies, that debate starts with a practical question: can we link the information we already have to manage our energy better?
What an energy silo is, with examples from the plant
An energy silo is a source of information on consumption, costs or operations that is difficult to relate to the others. The separation may be due to incompatible systems, access permissions, different formats or unclear responsibilities.
In an industrial plant, you may find side by side:
- The main meter, with the load curve available through the distribution company or Datadis (the Spanish distributors’ consumption-data platform), depending on the supply and the data accessible.
- The plant supervision and control system (SCADA), with temperatures, machine states and other operating variables.
- Power analysers and submeters, which record the consumption of distribution boards, lines or equipment.
- Gas, boiler and industrial refrigeration records, with their own control systems.
- Invoices, production and the operating calendar, spread across administration, production and other departments.
Each system may work properly. The problem arises when cross-referencing their data requires exports, emails and spreadsheets every time someone needs an answer.
With metering by machine and process we can identify what is consuming energy. To interpret that consumption, we also need to know what was being produced, for how long and under what conditions.
The data exists. The value comes from connecting it.
Separate data
- Consumption and meters
- Production and machines
- Invoices and contract
Careful integration
- Align dates and units
- Check quality and continuity
- Add operating context
Better-informed decisions
- Energy cost per process
- Deviations to investigate
- Comparable indicators
Cross-referencing consumption, production and contract terms lets you answer questions that each system, on its own, leaves open.
What energy silos cost
Their cost shows up in three places: the opportunities that go unnoticed, the work of rebuilding information and the time it takes to respond.
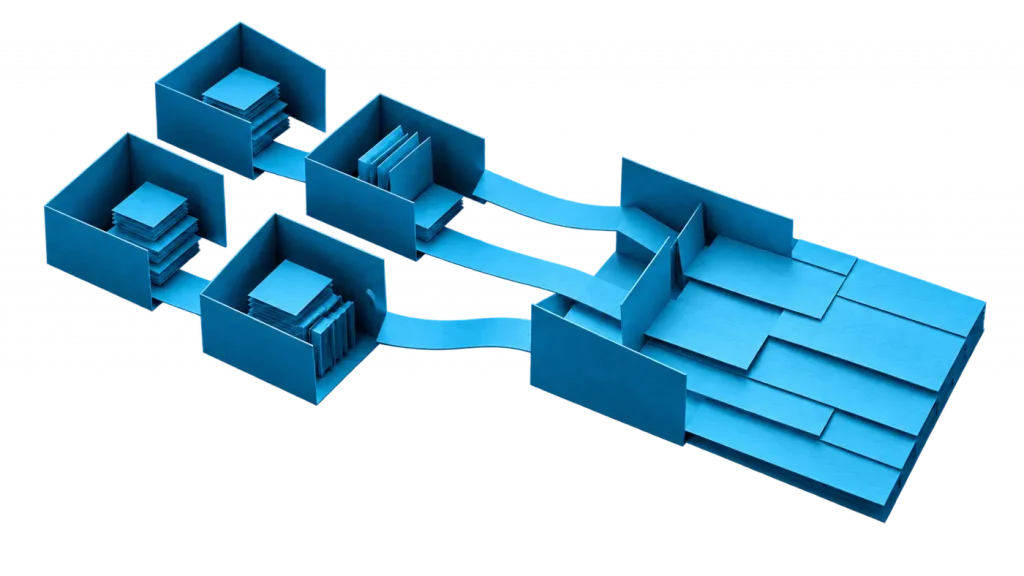
Decisions that are never even considered. If consumption and price remain separate, it becomes harder to calculate the real energy cost of each process. If production and energy are not linked, a line that manufactures more may look less efficient simply because it consumes more.
Work that keeps being repeated. Preparing information for senior management, an audit or a formal dossier may mean exporting from several systems, reconciling dates, checking units and finding gaps. When that process is not organised, it has to be rebuilt for every review.
Deviations spotted too late. Discovering a piece of equipment running outside operating hours when the bill arrives leaves less room to respond than identifying it during operation. To make the most of the data, you need a suitable update frequency, a threshold and someone responsible for taking action.
That is why industrial energy efficiency indicators need consistent information and context. A chart can show the change; explaining its cause requires relating the variables that drive it.
How to connect IT and OT without creating another silo
IT refers to the information technologies that run the business: applications, databases and corporate systems. OT refers to the technologies that monitor or control physical machines and processes.
Integrating both environments makes it possible to relate what happens on the plant floor to its energy and financial consequences. Doing it well means reviewing three aspects.
- Genuine compatibility. Industrial protocols, application programming interfaces (APIs) and gateways make connection easier. But sharing a protocol does not guarantee that all the data is accessible or that it means the same thing. You need to check equipment, versions, permissions, documentation and any licensing requirements.
- Data quality. A platform can receive information from several systems and still show incorrect comparisons if it mixes units, intervals or dates. Integration must identify gaps, duplicates and changes in measurement criteria.
- Security and operational continuity. The NIST OT security guide addresses the particular needs of these environments. Access to information must respect plant availability and security, with appropriate permissions and communications.
Local processing, known as edge computing, can help collect and transform data close to the equipment. Some solutions can also store data during a communications outage. How useful it is depends on the architecture and on the functions that have been planned.
The question when choosing a platform should be specific: which sources at our site can you integrate, how do you prove it and what limitations are there?
What companies can do before the Smart Energy Congress
The first step is to locate the information available and choose a decision worth resolving. That inventory lets you approach suppliers, production and maintenance with specific questions.
01 · Locate where each piece of data lives
Note where consumption, production, prices and machine states are stored; who has access, how often they are updated and what history exists. Include electricity, gas and auxiliary services where relevant.
02 · Choose a question that justifies the effort
Start with a specific case: what consumes energy during a stoppage, how much a line costs or why two comparable processes behave differently. That question defines which data you need to integrate first.
03 · Check that the data can be compared
Review units, logging frequency, dates, clock changes, gaps and duplicates. Add production, schedules or machine states to interpret consumption in context.
04 · Ask for a test with your own systems
Request a demonstration of access to the chosen sources, their dependencies and their limits. Check how complete delivery of the information will be validated and how it will be recovered after an interruption, if that function is needed.
05 · Define who receives the information and who acts
Agree who validates the data, receives an alert and can review maintenance, adjust operations or approve a decision. Also define how the result of each action will be checked.
With that preparation, the conversation changes: these are our sources, this is the decision we need to make and these are the criteria for checking whether the integration works.
A well-defined first case also helps you assess what is worth extending to the rest of the plant.
The PowerCloud view
PowerCloud brings together energy and operational information so you can analyse consumption, costs and performance in a shared environment. Integration starts from the equipment, systems, access and communications available at each site.
By relating the overall load curve to process-level measurements and activity variables, a company can compare lines, pinpoint deviations and keep a history to review what happened before and after an intervention.
Update frequency and scope are tailored to the analysis you want to carry out. The aim is for production, maintenance and senior management to work with consistent information and be able to check the outcome of their decisions.
The Smart Energy Congress will put these connections between technology, operations and efficiency on the table. For each company, the practical step starts at its own site: identifying which information is still kept separate and which decision could improve by connecting it.
Your data is already there. Take the first step to connect it.
We review with you what consumption, production and cost information you have available and which sources are worth connecting so you can start making better-informed decisions.
Connect my data