Measure better → calculate the real cost → manage by indicators. These are the three building blocks of an energy management system (EnMS). In this post, we cover the first one: monitoring by machine and process, what the industry calls submetering — installing secondary metering downstream of the main meter so you know not only how much your plant consumes, but who, when and what for. The date is no coincidence: today is the very day the 96-round intraday market goes live (in Spanish) — the whole market is moving towards fine-grained detail, and plant-level metering is the piece most companies are missing if they want to keep pace with it.
What the main meter can’t tell you
The smart meter on your supply (in Spanish) is a great starting point: a quarter-hourly load profile, free of charge and already installed. But it gives you a single figure for the whole plant. It tells you that at 11:15 yesterday you were drawing 480 kW; it doesn’t tell you whether that was the compressors, the furnaces, the refrigeration or a valve left open that nobody spotted.
That blind spot has concrete consequences: phantom (idle) consumption at weekends and during shutdowns stays hidden within the total; two identical lines that consume differently (in Spanish) can’t be compared; and any efficiency project — or its application for CAEs (Spain’s Energy Savings Certificates) — lacks the measurement boundary that a verifier requires.
What submetering means in practice
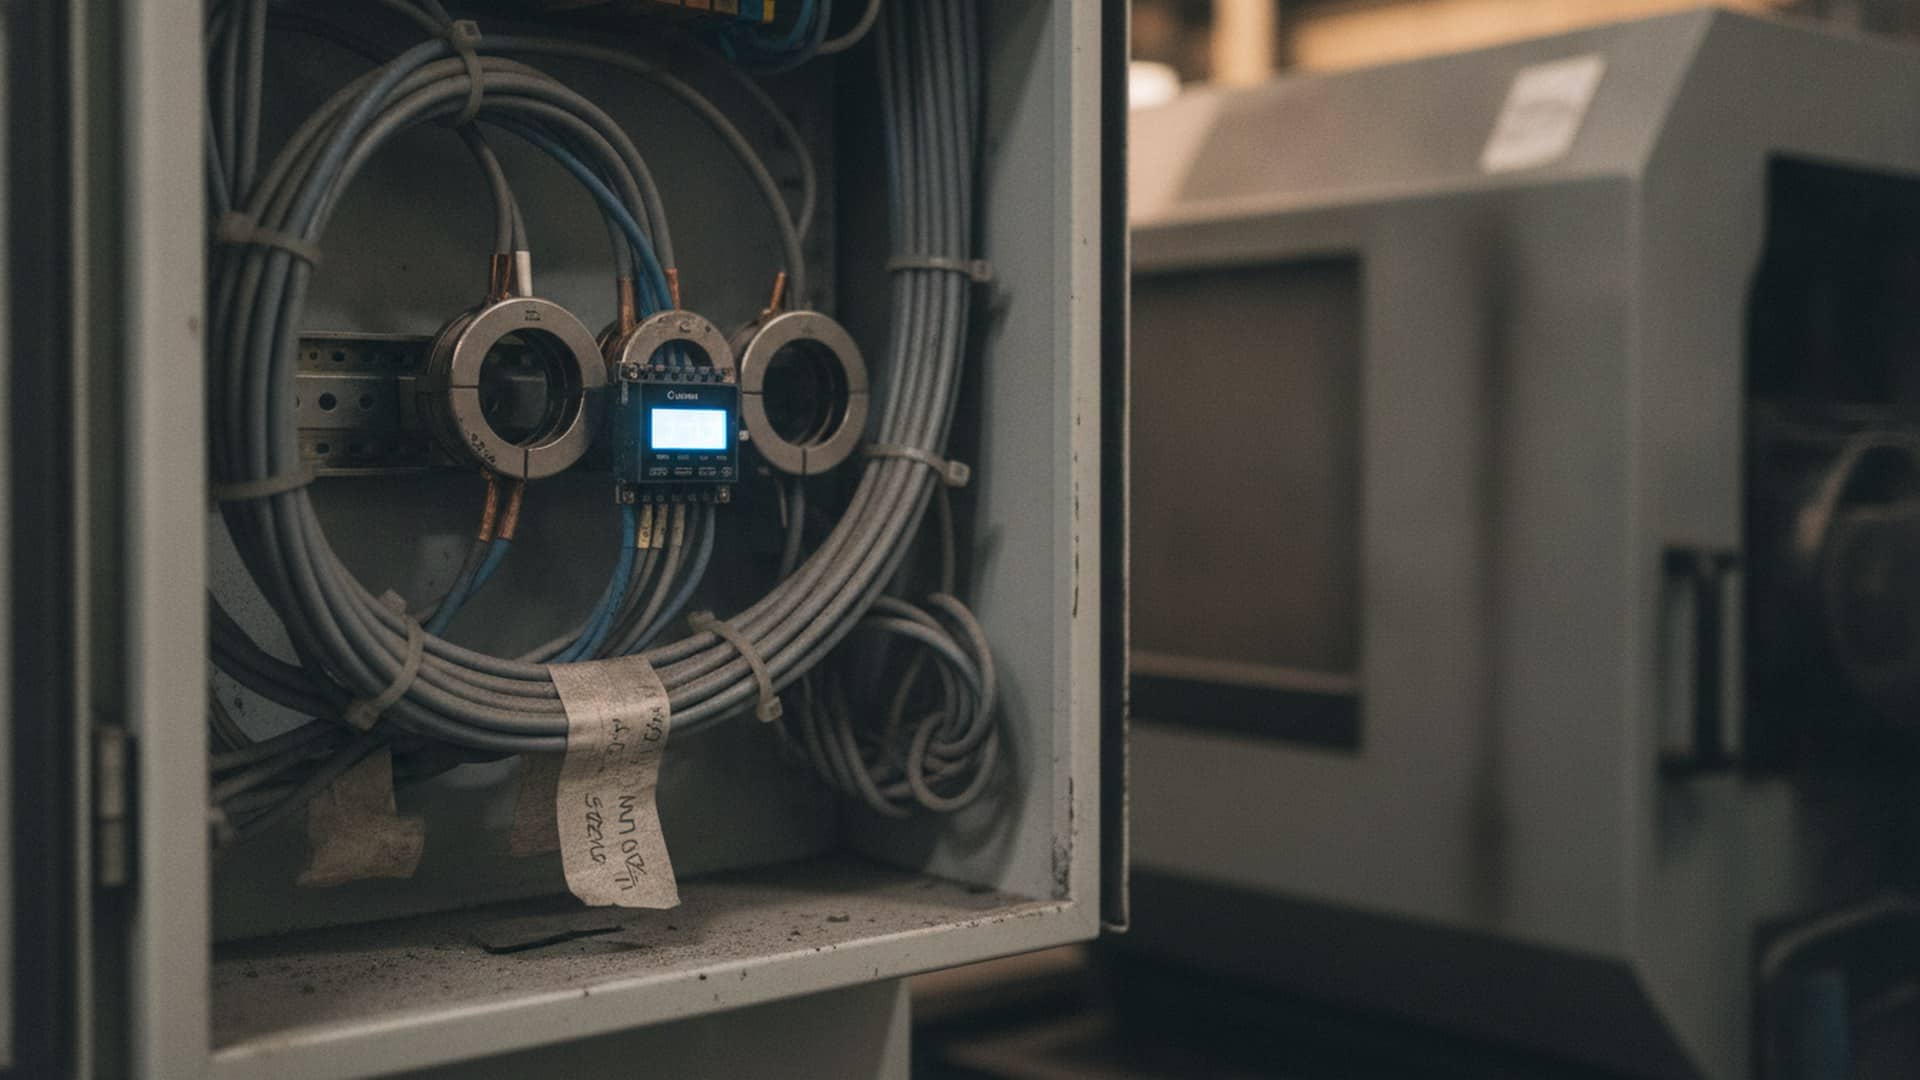
It means installing secondary metering devices — panel-mounted power analysers, current clamps, line meters — in the areas, processes or machines that carry real weight. You don’t need to cover the entire plant: the rule of thumb is to start with the significant energy uses — the three to six points that account for the bulk of consumption or of uncertainty.
The technology has matured and become cheaper: IIoT (Industrial Internet of Things) devices that speak the usual plant protocols—Modbus, BACnet, M-Bus, even over Wi-Fi and/or LoRaWAN radio where cabling is expensive—with panel-by-panel installation that rarely requires a shutdown. For an industrial SME, basic metering by line or process has gone from being an engineering project to a job of a few days.
The savings ranges documented by the industry when moving from a main meter to process-level metering run from 20% to 30% of consumption in facilities with no prior monitoring — not because measuring saves anything in itself, but because of what shows up when you look: idle consumption, equipment running outside operating hours, performance drift, compressed-air leaks, forgotten setpoints.
Where to start: the five points that almost always pay for the installation
- Compressed air — the king of leaks and idle consumption; almost always the first finding.
- Industrial refrigeration and HVAC — big consumers running on schedules that nobody reviews.
- The line or process with the greatest weight in production — the basis for the cost per unit produced that we’ll look at in the second instalment.
- Duplicated processes — two furnaces, two lines, two cold rooms: metering both turns comparison into a method.
- The main feeder of each building or area — so the total always adds up and any gaps come to light.
With those points metered, every new reading is cross-referenced with the main meter’s load profile and the market price — and that’s where the second instalment of this series begins: what each process really costs, which we publish on Wednesday.
The PowerCloud view
Submetering without a platform is just a collection of little screens on electrical panels. PowerCloud integrates the secondary measurements — via standard plant protocols — alongside the main meter’s load profile and the quarter-hourly price in your contract, and turns them into what actually gets used: comparisons between processes, alerts for consumption that breaks its usual pattern, detection of phantom loads during shutdowns, and the documented measurement boundary that any submission — CAEs, ISO 50001, grants — will sooner or later require. Metering by machine is half the job; having someone look at the data every day is the other half.
Does your plant have a single meter for everything? It’s the most common starting point. We’ll help you design a minimum submetering map — which three to six points to meter first, with what equipment and what return to expect — using your actual main-meter load profile as the basis.